
Site loading speed is an important indicator for SEO promotion, as it significantly affects the behavioral factor. If the site loads slowly, the user will not have to wait long, but will simply close the tab and go to the competitor's site. Google takes into account such a metric as the number of bounces, so if visitors leave the site too quickly, it will sink in the positions.
But the main reason why it is worth monitoring and improving download speed is convenience for users. Every web resource owner would like customers to return to the site again, recommend it to friends and feel comfortable.
Today we will tell you about the main metrics of site loading, the tools that can be used to measure them and the methods to improve these indicators.
Read also: " How hosting affects the ranking and promotion of the site "
Basic site loading speed metrics
TTFB (Time To First Byte) — the time interval from sending a request to the hosting , on which the site is located, to the first byte of information sent in response. Between these two phases, a lot of things happen — redirection, DNS lookup, TLS negotiation, and more. All these processes are succinctly called "request processing". TTFB is an important metric for the site, which should be no more than 2-3 seconds.
FCP (First Contentful Paint) — the time before the user sees the first content on the site; primary, partial rendering. This metric does not take into account the iframe loading rate, meaning text (including the one for which fonts have not yet been loaded), images or canvas elements (a canvas that looks like a non-white die). The optimal time is up to 1.8 seconds.
LCP (Largest Contentful Paint ) is the time when most of the content on the visible part of the screen is already viewable. 2.5 seconds is considered a good indicator. To calculate the LCP metric, the rendering time of the largest element (text block or image) from the start of site loading is used.
FID (First Input Delay) is the time from the user's first interaction with interactive elements (clicking a button, entering text in a field, clicking a link) to the moment when the browser starts responding to them. This process should take 1 second or less. Action response time is also an important metric for a site's reputation, because a user doesn't like it when they click a button and nothing happens.
TTI (Time To Interactive) is literally translated as "time to interactivity", when the main content has already been uploaded and the user not only sees interactive elements, but can fully interact with them.
INP (Interaction to Next Paint) is an indicator of the speed of the page's response to user actions that occur after the site is fully loaded. This is the amount of time that elapses between clicking on an item and responding to it. The optimal reaction speed is up to 200 milliseconds.
TTB (Total Blocking Time) is the total blocking time that passes from the start of content rendering (FCP) to site interactivity (TTI). During this period, the user already sees the content, but cannot yet press buttons and other active elements. An indicator of 300 milliseconds is considered good.
CLS (Cumulative Layout Shift) — displacement of the layout due to the loading of heavier elements. Let's imagine that the user opened the site, saw the necessary link and clicked on it, but at that moment a block (video or image) was opened above, which took a long time to load. Because of this, the layout shifted, the link "went" down, the user clicked on the ad instead, and the advertiser's site started loading. Such "jumps" of the layout are annoying, so CLS is considered one of the main indicators that all major speed measurement tools analyze. In 2021, new rules for evaluating this metric were approved, and now the basis is a time window of up to 5 seconds, when displacements occur, with a break of less than 1 second.
Speed Index — shows the speed of displaying content during download. For example, the main content was uploaded on the site in 4 seconds. But in one case, during the first three seconds, the user sees only a white screen, and in the second, the rendering of small details, titles, and dies begins already in the first second. It's like the site loaded in the same amount of time in both cases, so what difference did it make what happened on the screen? But it's better for the user to see some movement on the page than to just wait, staring at a static white field. Therefore, even if not very informative blocks appear in the process, they make it clear that the site is loading. This has a positive impact on the user experience.
Core Web Vitals are the three core metrics that Google identifies as most important. These include rendering of most of the content, time to first interactivity, and cumulative content displacement (LCP, FID, CLS).
How to check site loading speed
A number of tools are used to analyze key download metrics, most of which are free. They can show indicators on different metrics, besides, the results can vary depending on the service, so usually webmasters use 2-3 tools and compare the data obtained. One of the useful functions is a second-by-second "storyboard" of the site, which allows you to understand what users see at various stages of loading.
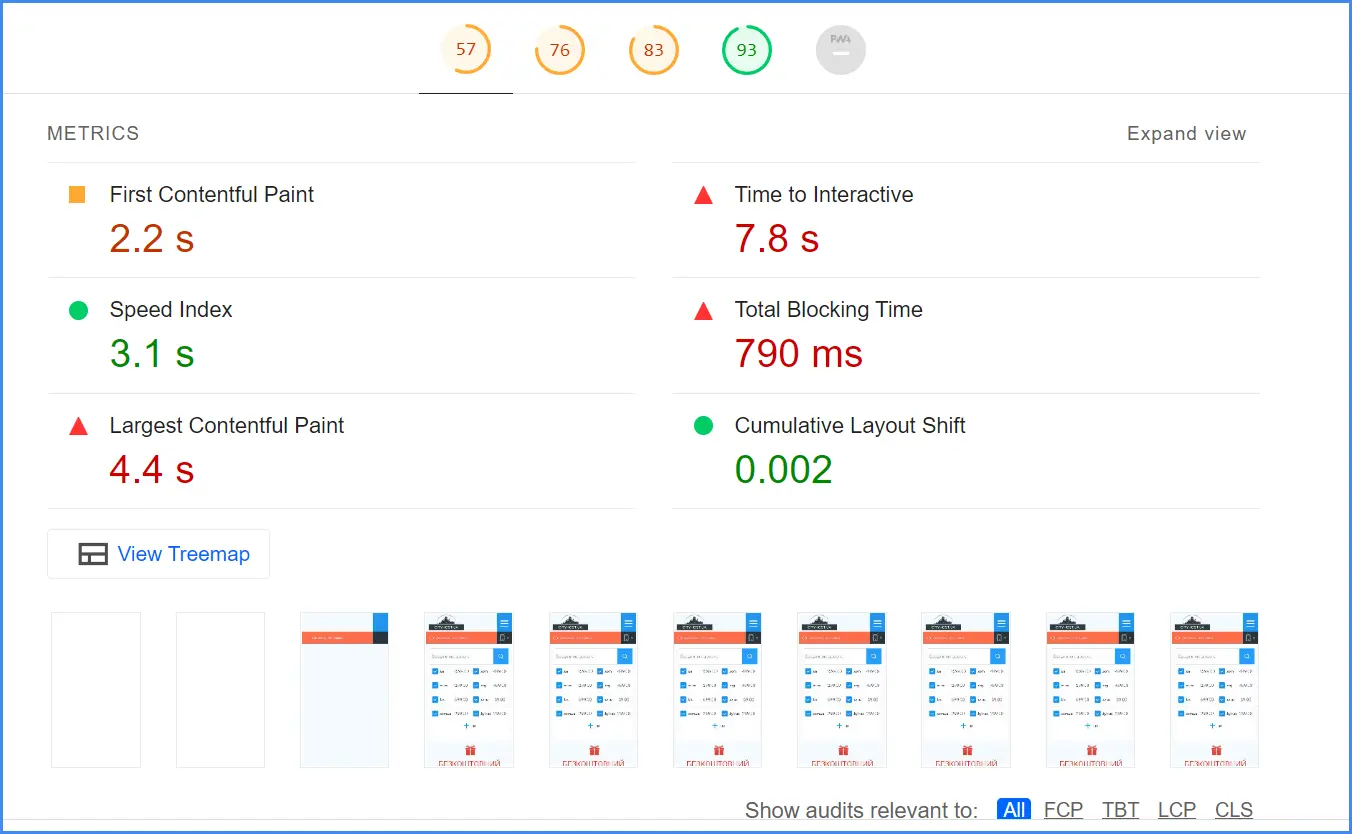
Scan results using the Lighthouse extension
Above, we described the optimal download speed according to various parameters, but you can relax - you don't have to calculate how good the result is. The tools themselves determine the level of indicators: good results are highlighted in green, acceptable in orange, and low in red.
The main tools for checking site speed:
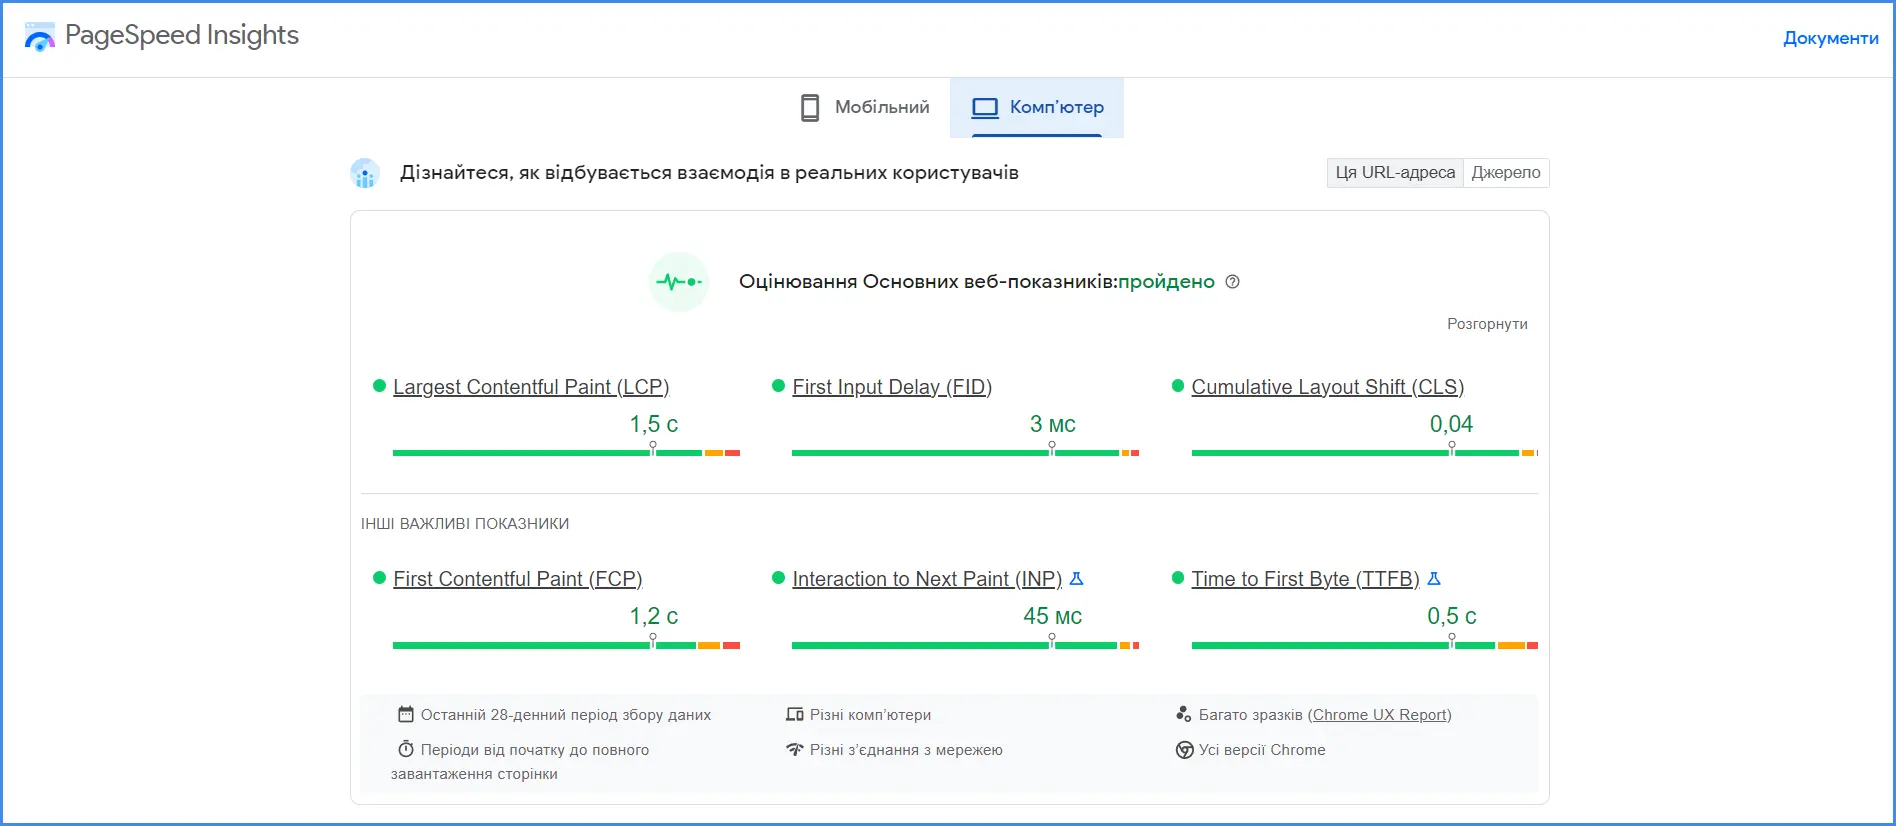
The choice of tool depends only on the user's preferences. The only thing we can advise is to definitely include PageSpeed Insights in the service package, since it is developed by the same Google in which we promote the site.
How to improve speed performance
Of course, every webmaster would like to see all the metrics glow green. But it is difficult to achieve such a result, and some indicators do not radically affect the user's perception of the site, but at the same time require a lot of time to correct small errors. There is no need to try to make all results perfect and reach 100%. It is more important to work with basic metrics and keep them within acceptable limits so that the site remains user-friendly.
To improve the parameters of the download speed, you need to use a number of methods that are universal for all sites.
Follow the advice offered by the speed analysis service
All tools have a section of advice, which is formed based on the analysis of your site - the service itself finds errors and offers ways to eliminate them.
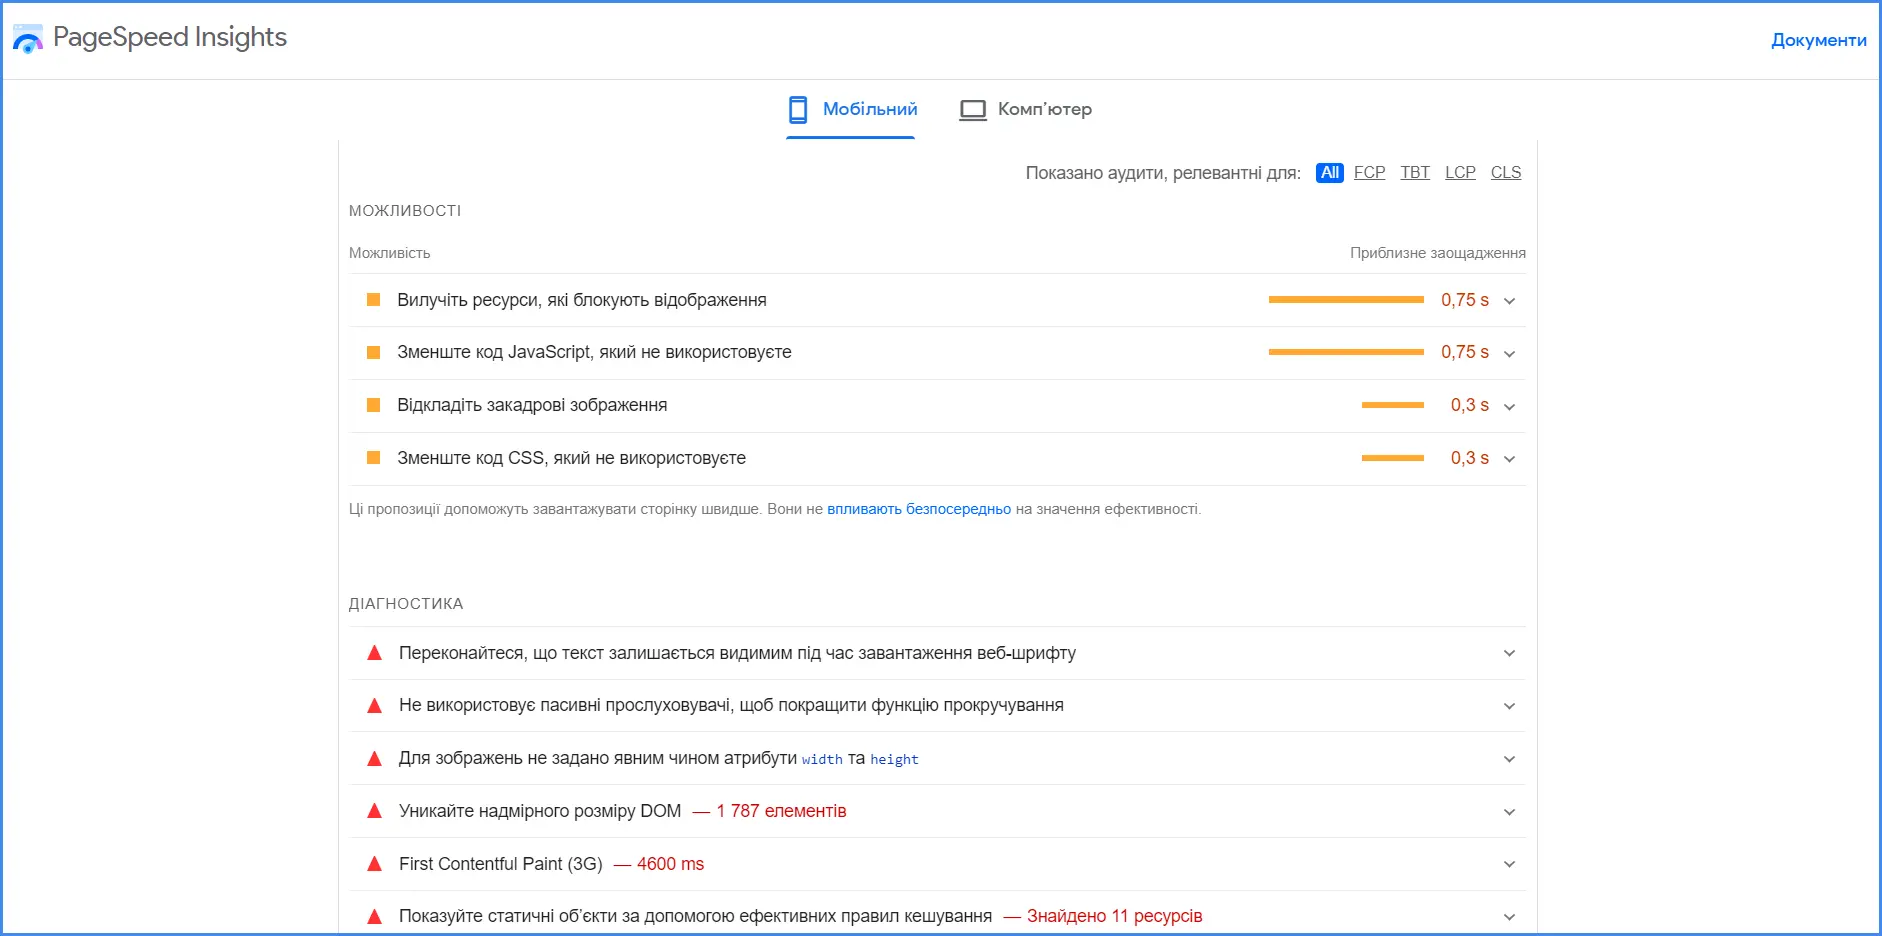
Optimize your content, code and database
Download speed is significantly affected by the size of media content — images and videos. A large number of heavy files will slow down the pages, so it is worth considering whether you need, for example, a banner with a video in the header of the site or a high-resolution image for the background. Images must be compressed and use the webp format, which allows you to reduce their weight without losing quality.
Enable lazy loading of images. In order for the user to see the first content as quickly as possible, use Lazy Loading. In this case, only those images that are on the visible part of the screen are uploaded to the site. Others will appear only when they are in the user's field of vision. In this way, the resource is not wasted on completely redrawing the page and the loading time is reduced.
You also need to find areas of code that are not being used or are running too slowly. Use code optimization tools that automatically compress it.
Databases also affect speed, so you need to regularly clean them of outdated data.
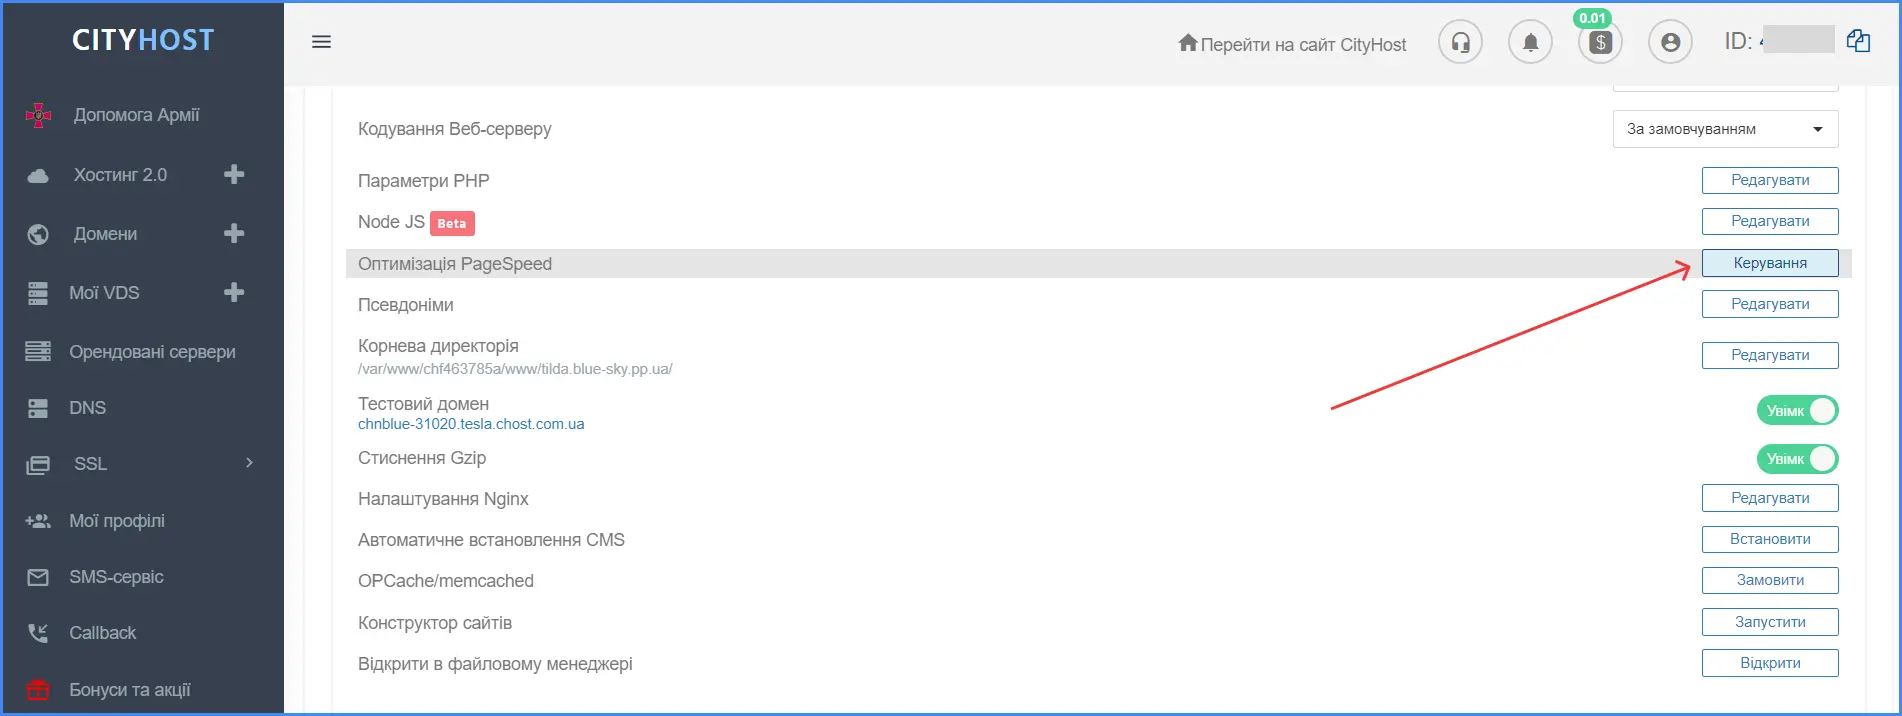
You can use various tools or manual methods to do this, but most of the options mentioned are in the PageSpeed module, which is available to activate directly on the hosting. In the Cityhost client panel, it is activated in the section Hosting 2.0 => Management => Sites. During activation, you can enable all available functions, or you can select only those that you need.
Use only the necessary modules on the CMS
Modules and plugins significantly load the site's resources. Therefore, it is better to choose only those that really work effectively, it is better to disable all others or delete them altogether. Periodically check the plugins section in the admin panel to understand which ones you need and which ones are no longer relevant.
Enable server caching
Server caching allows you to create and store frequently repeated scripts for dynamic sites in RAM. To understand the issue and learn how to connect these tools, read the article " Caching services for sites: Memcached, OPCache, Redis ".
Choose quality hosting
For the site, you will need virtual hosting or renting a server (VPS or dedicated) - it all depends on its resource capacity. But you should always remember that the technical condition of the servers affects the speed of loading pages. A responsible provider uses high-quality components, takes care of their timely replacement and monitors the operation of servers.
Go with hosting providers with a good reputation and positive customer reviews. Do not skimp on services, because high-quality components and hiring high-class specialists cannot be cheap. You can win a couple of hundred hryvnias on hosting, but at the same time get a low-quality service that will nullify all efforts to optimize the site's speed.
Read also: " TOP 11 advantages of the domain registrar and hosting provider Cityhost "


